Tabellenverzeichnis
Abbildungsverzeichnis
1 Flächen
| Flächenart in km² | Pillerseetal | Bezirk KI | Tirol |
|---|---|---|---|
| Fläche | 234,4 | 1.163,3 | 12.648,4 |
| Dauersiedlungsraum | 45,6 | 277,0 | 1.630,8 |
| Anteil am Dauersiedlungsraum | 19,4 | 23,8 | 12,9 |
- Quelle: Bundesamt für Eich- und Vermessungswesen
| Widmungskategorie | Flächein ha | m² / Einwohner | Anteil am DSR in % | ||||
|---|---|---|---|---|---|---|---|
| Pillerseetal | Bezirk KI | Tirol | Pillerseetal | Bezirk KI | Tirol | ||
| Bauland und Sonderflächen¹ | 538,1 | 500,7 | 371,6 | 291,8 | 11,8 | 8,9 | 13,9 |
| Wohngebiete | 233,0 | ||||||
| Mischgebiete | 68,5 | ||||||
| Gewerbe- und Industriegebiete | 44,3 | ||||||
| Baulandähnliche Sonderflächen | 192,4 | ||||||
| Landwirtschaftliche Sonderflächen | 29,4 | ||||||
- Quelle: AdTLR, Abt. Raumordnung und Statistik
- ¹ ausgenommen freilandähnilche Sonderflächen und landwirtschaftliche Sonderflächen
- DSR = Dauersiedlungsraum
2 Naturschutzgebiete
| Schutzgebiete | Fläche in ha | Anteil anGesamtflächein % | Anteil derSchutzgebiete an derGesamtfläche in % | |
|---|---|---|---|---|
| Pillerseetal | Bezirk KI | Tirol | ||
| Nationalpark Kernzonen | - | - | - | 2,7 |
| Nationalpark Außenzonen | - | - | - | 2,1 |
| Naturschutzgebiete | - | - | 1,9 | 5,9 |
| Landschaftsschutzgebiete | 2.647 | 11,3 | 9,5 | 5,3 |
| Geschützte Landschaftsteile | 7 | 0,0 | 0,2 | 0,1 |
| Ruhegebiete | - | - | - | 10,8 |
| Sonderschutzgebiete | - | - | - | 0,0 |
| Schutzgebiete insgesamt | 2.653 | 11,3 | 11,5 | 26,9 |
- Quelle: AdTLR, Abt. Umweltschutz
3 Bauentwicklung
| Jahr | Gebäude | Index 2001 = 100 | ||||
|---|---|---|---|---|---|---|
| Pillerseetal | Bezirk KI | Tirol | Pillerseetal | Bezirk KI | Tirol | |
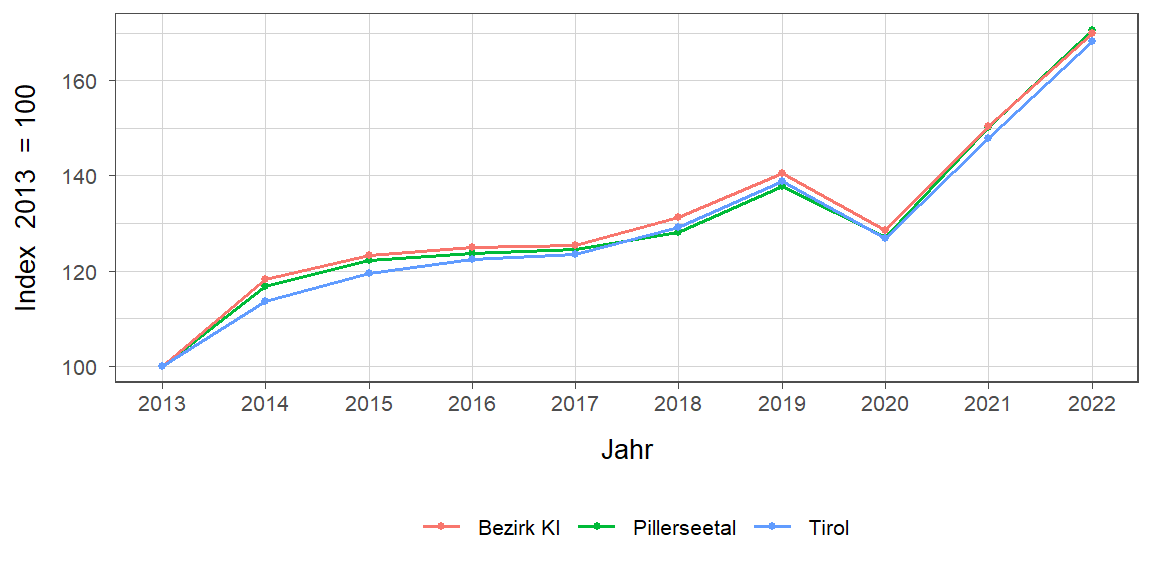
| 1971 | 1.615 | 10.264 | 91.331 | 53,5 | 52,0 | 56,6 |
| 1981 | 2.247 | 13.903 | 116.875 | 74,5 | 70,4 | 72,5 |
| 1991 | 2.716 | 16.874 | 138.537 | 90,0 | 85,5 | 85,9 |
| 2001 | 3.018 | 19.742 | 161.261 | 100,0 | 100,0 | 100,0 |
| 2011 | 3.372 | 21.755 | 177.745 | 111,7 | 110,2 | 110,2 |
| 2021 | 3.816 | 23.606 | 193.876 | 126,4 | 119,6 | 120,2 |
| 2025 | 4.179 | 26.538 | 215.287 | 138,5 | 134,4 | 133,5 |
- Quelle: Statistik Austria, Gebäude und Wohnungsregister
Abbildung 1: Entwicklung der Anzahl an Gebäuden
| Gebäudenutzung | Anzahl | Anzahl an allen Gebäuden in % | ||
|---|---|---|---|---|
| Pillerseetal | Bezirk KI | Tirol | ||
| Gebäude mit einer Wohnung | 2.076 | 49,7 | 44,8 | 44,9 |
| Gebäude mit zwei oder mehr Wohnungen | 1.355 | 32,4 | 34,4 | 34,7 |
| Wohngebäude von Gemeinschaften | 5 | 0,1 | 0,2 | 0,3 |
| Hotels und ähnliche Gebäude | 180 | 4,3 | 4,1 | 4,1 |
| Andere Gebäude¹ | 563 | 13,5 | 16,4 | 16,0 |
- Quelle: Statistik Austria, Gebäude und Wohnungsregister
- ¹ umfasst Bürogebäude, Gebäude des Groß- oder Einzelhandels, Gebäude des Verkehrs- oder Nachrichtenwesens, Werkstätten, Industrie- oder Lagerhallen, Gebäude für Kultur-und Freizeitzwecke sowie des Bildungs- und Gesundheitswesens, Gebäude mit sonstiger Nutzung.
| Jahr | Wohnungen | Index 2001 = 100 | ||||
|---|---|---|---|---|---|---|
| Pillerseetal | Bezirk KI | Tirol | Pillerseetal | Bezirk KI | Tirol | |
| 1971 | 2.010 | 14.260 | 160.196 | 47,8 | 44,1 | 52,8 |
| 1981 | 2.667 | 20.228 | 203.762 | 63,4 | 62,5 | 67,1 |
| 1991 | 3.465 | 26.346 | 249.774 | 82,3 | 81,4 | 82,3 |
| 2001 | 4.209 | 32.367 | 303.632 | 100,0 | 100,0 | 100,0 |
| 2011 | 5.198 | 40.097 | 375.583 | 123,5 | 123,9 | 123,7 |
| 2021 | 6.128 | 45.247 | 423.796 | 145,6 | 139,8 | 139,6 |
| 2025 | 6.543 | 47.652 | 443.598 | 155,5 | 147,2 | 146,1 |
- Quelle: Statistik Austria, Gebäude und Wohnungsregister
4 Wohnbevölkerung
| Jahr | Personen | Index 2001 = 100 | ||||
|---|---|---|---|---|---|---|
| Pillerseetal | Bezirk KI | Tirol | Pillerseetal | Bezirk KI | Tirol | |
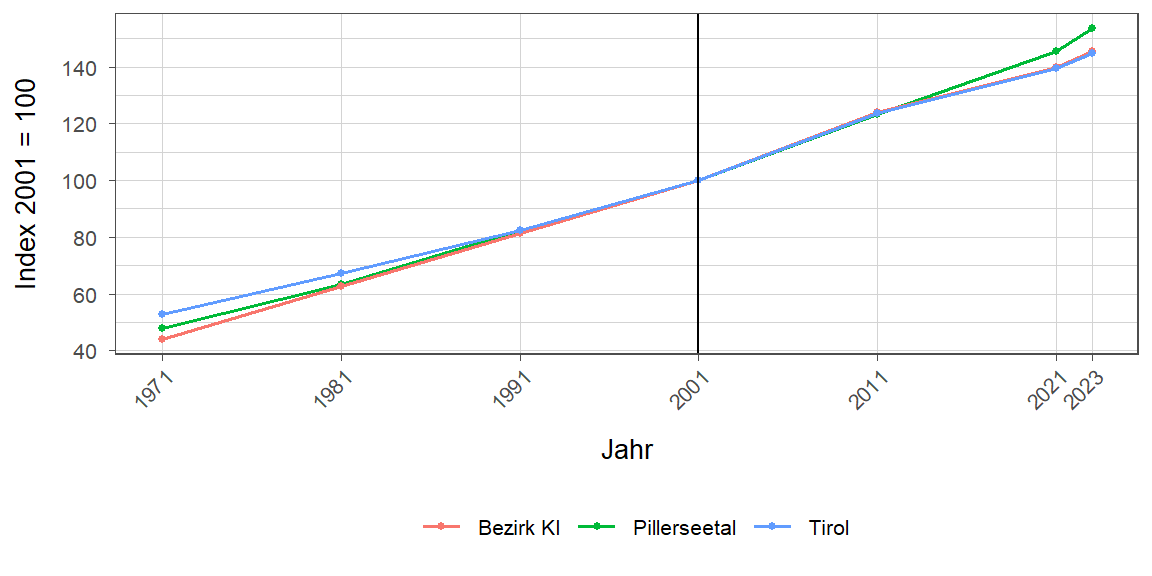
| 1961 | 6.234 | 39.795 | 462.899 | 68,2 | 67,2 | 68,7 |
| 1971 | 7.442 | 46.340 | 540.771 | 81,4 | 78,3 | 80,3 |
| 1981 | 8.037 | 49.747 | 586.663 | 87,9 | 84,0 | 87,1 |
| 1991 | 8.730 | 54.127 | 631.410 | 95,5 | 91,4 | 93,8 |
| 2001 | 9.142 | 59.191 | 673.504 | 100,0 | 100,0 | 100,0 |
| 2011 | 9.776 | 61.705 | 709.319 | 106,9 | 104,2 | 105,3 |
| 2021 | 10.552 | 64.812 | 762.652 | 115,4 | 109,5 | 113,2 |
| 2025 | 10.748 | 66.067 | 777.660 | 117,6 | 111,6 | 115,5 |
- Quelle: Statistik Austria, (bis inkl. 2001) Volkszählung, (ab 2011) Registerzählung
Abbildung 2: Entwicklung der Wohnbevölkerung
| Alter | Personen | in % der Wohnbevölkerung | ||||
|---|---|---|---|---|---|---|
| Pillerseetal | Bezirk KI | Tirol | Pillerseetal | Bezirk KI | Tirol | |
| unter 15 | 1.551 | 8.689 | 111.583 | 14,4 | 13,2 | 14,3 |
| 15 bis 64 | 6.910 | 42.129 | 512.072 | 64,3 | 63,8 | 65,8 |
| 65 oder älter | 2.287 | 15.249 | 154.005 | 21,3 | 23,1 | 19,8 |
- Quelle: Statistik Austria, (bis inkl. 2001) Volkszählung, (ab 2011) Bevölkerungsregister
| Bildung | Personen | in % der Wohnbevölkerung im Alter von 15 u. mehr Jahren | ||||
|---|---|---|---|---|---|---|
| Pillerseetal | Bezirk KI | Tirol | Pillerseetal | Bezirk KI | Tirol | |
| Pflichtschule | 1.954 | 12.374 | 157.538 | 21,3 | 21,6 | 23,8 |
| Lehrabschluss | 3.659 | 21.641 | 213.327 | 39,9 | 37,8 | 32,2 |
| Berufsbild. mittlere S. | 1.605 | 9.783 | 98.881 | 17,5 | 17,1 | 14,9 |
| Allg. bild. höhere S. | 370 | 2.655 | 37.936 | 4,0 | 4,6 | 5,7 |
| Berufsbild. höhere S. | 729 | 4.385 | 50.188 | 7,9 | 7,7 | 7,6 |
| Kolleg | 44 | 263 | 4.526 | 0,5 | 0,5 | 0,7 |
| Akademie | 127 | 895 | 12.907 | 1,4 | 1,6 | 1,9 |
| Hochschule | 686 | 5.202 | 87.558 | 7,5 | 9,1 | 13,2 |
- Quelle: Statistik Austria, Abgestimmte Erwerbsstatistik
| Jahr | Insgesamt | Wanderungs-saldo | Geburten-bilanz | in % der Wohnbevölkerung 1961 | ||
|---|---|---|---|---|---|---|
| Insgesamt | Wanderungs-saldo | Geburten-bilanz | ||||
| 1961/1971 | 1.208 | 49 | 1.185 | 19,4 | 0,8 | 19,0 |
| 1971/1981 | 569 | 73 | 496 | 9,1 | 1,2 | 8,0 |
| 1981/1991 | 693 | 24 | 669 | 11,1 | 0,4 | 10,7 |
| 1991/2001 | 412 | -2 | 414 | 6,6 | -0,0 | 6,6 |
| 2001/2011 | 634 | 414 | 220 | 10,2 | 6,6 | 3,5 |
| 2011/2021 | 776 | 554 | 222 | 12,4 | 8,9 | 3,6 |
- Quelle: Statistik Austria, Volkszählung bzw. Bevölkerungsregister
| Jahr | Insgesamt | Wanderungs-saldo | Geburten-bilanz | jährliche Veränderung in % | ||
|---|---|---|---|---|---|---|
| Insgesamt | Wanderungs-saldo | Geburten-bilanz | ||||
| 2018 | 73 | 40 | 33 | 0,7 | 0,4 | 0,3 |
| 2019 | 108 | 99 | 9 | 1,1 | 1,0 | 0,1 |
| 2020 | 109 | 81 | 28 | 1,1 | 0,8 | 0,3 |
| 2021 | 203 | 185 | 18 | 2,0 | 1,8 | 0,2 |
| 2022 | 137 | 106 | 31 | 1,3 | 1,0 | 0,3 |
| 2023 | 15 | 28 | -13 | 0,1 | 0,3 | -0,1 |
| 2024 | -11 | -23 | 12 | -0,1 | -0,2 | 0,1 |
| 2018/2024 | 634 | 516 | 118 | 6,4 | 5,2 | 1,2 |
- Quelle: Statistik Austria, Bevölkerungsregister
| Jahr | Personen | jährliche Veränderung in % | ||||
|---|---|---|---|---|---|---|
| Zuzüge | Wegzüge | Saldo | Zuzüge | Wegzüge | Saldo | |
| 2018 | 647 | 607 | 40 | 6,4 | 6,0 | 0,4 |
| 2019 | 699 | 600 | 99 | 6,9 | 5,9 | 1,0 |
| 2020 | 773 | 692 | 81 | 7,5 | 6,7 | 0,8 |
| 2021 | 967 | 782 | 185 | 9,3 | 7,5 | 1,8 |
| 2022 | 1.489 | 1.383 | 106 | 14,0 | 13,0 | 1,0 |
| 2023 | 948 | 920 | 28 | 8,8 | 8,6 | 0,3 |
| 2024 | 676 | 699 | -23 | 6,3 | 6,5 | -0,2 |
| 2018/2024 | 6.199 | 5.683 | 516 | 62,2 | 57,0 | 5,2 |
- Quelle: Statistik Austria, Wanderungsstatistik
| Jahr | Personen | jährliche Veränderung in % | ||||
|---|---|---|---|---|---|---|
| Geburten | Sterbefällr | Saldo | Geburten | Sterbefällr | Saldo | |
| 2018 | 110 | 77 | 33 | 1,1 | 0,8 | 0,3 |
| 2019 | 97 | 88 | 9 | 1,0 | 0,9 | 0,1 |
| 2020 | 103 | 75 | 28 | 1,0 | 0,7 | 0,3 |
| 2021 | 105 | 87 | 18 | 1,0 | 0,8 | 0,2 |
| 2022 | 106 | 75 | 31 | 1,0 | 0,7 | 0,3 |
| 2023 | 73 | 86 | -13 | 0,7 | 0,8 | -0,1 |
| 2024 | 99 | 87 | 12 | 0,9 | 0,8 | 0,1 |
| 2018/2024 | 693 | 575 | 118 | 7,0 | 5,8 | 1,2 |
- Quelle: Statistik Austria, Natürliche Bevölkerungsbewegung
5 Privathaushalte
| Jahr | Haushalte | Index 2001 = 100 | ||||
|---|---|---|---|---|---|---|
| Pillerseetal | Bezirk KI | Tirol | Pillerseetal | Bezirk KI | Tirol | |
| 1961 | 1.486 | 10.192 | 123.705 | 45,2 | 43,4 | 47,5 |
| 1971 | 1.823 | 12.416 | 157.267 | 55,5 | 52,9 | 60,3 |
| 1981 | 2.215 | 15.318 | 188.898 | 67,4 | 65,2 | 72,5 |
| 1991 | 2.768 | 18.954 | 219.783 | 84,3 | 80,7 | 84,3 |
| 2001 | 3.284 | 23.478 | 260.660 | 100,0 | 100,0 | 100,0 |
| 2011 | 3.852 | 26.305 | 296.712 | 117,3 | 112,0 | 113,8 |
| 2021 | 4.492 | 29.270 | 334.096 | 136,8 | 124,7 | 128,2 |
| 2023 | 4.680 | 30.074 | 342.300 | 142,5 | 128,1 | 131,3 |
- Quelle: Statistik Austria, Volkszählung bzw. Registerzählung, Abgestimmte Erwerbsstatistik
| Jahr | Personen pro Haushalte | ||
|---|---|---|---|
| Pillerseetal | Bezirk KI | Tirol | |
| 1961 | 4,2 | 3,9 | 3,7 |
| 1971 | 4,1 | 3,7 | 3,4 |
| 1981 | 3,6 | 3,2 | 3,1 |
| 1991 | 3,1 | 2,8 | 2,8 |
| 2001 | 2,7 | 2,5 | 2,6 |
| 2011 | 2,5 | 2,3 | 2,4 |
| 2021 | 2,3 | 2,2 | 2,2 |
| 2023 | 2,3 | 2,2 | 2,2 |
- Quelle: Statistik Austria, Volkszählung bzw. Registerzählung, Abgestimmte Erwerbsstatistik
| Jahr | Haushalte | in % der Privathaushalte | ||||
|---|---|---|---|---|---|---|
| Pillerseetal | Bezirk KI | Tirol | Pillerseetal | Bezirk KI | Tirol | |
| 1961 | 116 | 1.225 | 16.090 | 7,8 | 12,0 | 13,0 |
| 1971 | 180 | 1.854 | 31.826 | 9,9 | 14,9 | 20,2 |
| 1981 | 298 | 2.988 | 44.728 | 13,5 | 19,5 | 23,7 |
| 1991 | 491 | 4.581 | 55.078 | 17,7 | 24,2 | 25,1 |
| 2001 | 752 | 7.169 | 77.310 | 22,9 | 30,5 | 29,7 |
| 2011 | 1.058 | 9.003 | 100.474 | 27,5 | 34,2 | 33,9 |
| 2021 | 1.451 | 11.143 | 121.247 | 32,3 | 38,1 | 36,3 |
| 2023 | 1.602 | 11.800 | 126.989 | 34,2 | 39,2 | 37,1 |
- Quelle: Quelle: Statistik Austria, Volkszählung bzw. Registerzählung, Abgestimmte Erwerbsstatistik
6 Wirtschaft und Beschäftigung
| Jahr | Personen | Index 2001 = 100 | ||||
|---|---|---|---|---|---|---|
| Pillerseetal | Bezirk KI | Tirol | Pillerseetal | Bezirk KI | Tirol | |
| 1961 | 2.602 | 17.934 | 210.522 | 75,7 | 69,0 | 69,6 |
| 1971 | 2.315 | 17.243 | 207.802 | 67,4 | 66,4 | 68,7 |
| 1981 | 2.810 | 20.424 | 243.508 | 81,8 | 78,6 | 80,6 |
| 1991 | 3.283 | 22.977 | 272.092 | 95,6 | 88,4 | 90,0 |
| 2001 | 3.435 | 25.981 | 302.291 | 100,0 | 100,0 | 100,0 |
| 2011 | 3.635 | 27.463 | 328.424 | 105,8 | 105,7 | 108,6 |
| 2021 | 3.824 | 29.897 | 373.489 | 111,3 | 115,1 | 123,6 |
| 2023 | 3.878 | 30.826 | 382.239 | 112,9 | 118,6 | 126,4 |
- Quelle: Statistik Austria, Volkszählung bzw. Registerzählung
Abbildung 3: Entwicklung der Erwerbstätigen am Arbeitsort
| Jahr | gesamt | Land- undForstwirt-schaft | GewerbeundIndustrie | darunterBauwesen | Dienst-leistungen | darunterBegerber-gungsundGaststätten-wesen |
|---|---|---|---|---|---|---|
| 1961 | 2.602 | 998 | 1.054 | 208 | 550 | 149 |
| 1971 | 2.315 | 433 | 1.086 | 219 | 796 | 207 |
| 1981 | 2.810 | 342 | 1.145 | 238 | 1.323 | 427 |
| 1991 | 3.283 | 245 | 1.207 | 227 | 1.831 | 533 |
| 2001 | 3.435 | 180 | 1.232 | 313 | 2.023 | 540 |
| 2011 | 3.635 | 256 | 1.106 | 419 | 2.273 | 343 |
| 2021 | 3.824 | 154 | 1.327 | 482 | 2.343 | 445 |
| 2023 | 3.878 | 152 | 1.330 | 469 | 2.396 | 386 |
- Quelle: Statistik Austria, Volkszählung bzw. Registerzählung, Abgestimmte Erwerbsstatistik
| Jahr | am Wohnort | am Arbeitsort | ||
|---|---|---|---|---|
| weiblich | männlich | weiblich | männlich | |
| 1961 | - | - | 894 | 1.708 |
| 1971 | 803 | 1.889 | 689 | 1.626 |
| 1981 | 1.241 | 2.229 | 1.026 | 1.784 |
| 1991 | 1.392 | 2.435 | 1.176 | 2.107 |
| 2001 | 1.654 | 2.502 | 1.378 | 2.057 |
| 2011 | 2.045 | 2.653 | 1.512 | 2.123 |
| 2021 | 2.329 | 2.885 | 1.631 | 2.193 |
| 2023 | 2.412 | 2.870 | 1.667 | 2.211 |
- Quelle: Quelle: Statistik Austria, Volkszählung bzw. Registerzählung, Abgestimmte Erwerbsstatistik
| Jahr | Gemeinde-einpendler | Gemeinde-binnenpendler | Gemeinde-auspendler | Pendler-saldoabsolut | IndexdesPendler-saldos¹ |
|---|---|---|---|---|---|
| 1961 | 549 | - | 711 | -162 | 94 |
| 1971 | 569 | 1.035 | 946 | -377 | 86 |
| 1981 | 751 | 1.214 | 1.411 | -660 | 81 |
| 1991 | 1.184 | 1.303 | 1.728 | -544 | 86 |
| 2001 | 1.508 | 1.477 | 2.229 | -721 | 83 |
| 2011 | 1.594 | 1.427 | 2.657 | -1.063 | 77 |
| 2021 | 1.732 | 1.451 | 3.122 | -1.390 | 73 |
| 2023 | 1.755 | 1.506 | 3.159 | -1.404 | 73 |
- Quelle: Quelle: Statistik Austria, Volkszählung bzw. Registerzählung, Abgestimmte Erwerbsstatistik
- ¹ = (Erwerbstätige am Arbeitsort / Erwerbstätige am Wohnort)*100
- Ein Wert unter 100: Zahl der Auspendler aus den Gemeinden in einer Region überwiegt
- Ein Wert über 100: Zahl der Einpendler in Gemeinden einer Region überwiegt
Gemeindeeinpendler, Gemeindeauspendler: Personen, deren Wohn- und Arbeitsort in verschiedenen Gemeinden liegen, also Personen, die über Gemeindegrenzen hinweg pendeln.
Erwerbstätige: Personen ab 15 Jahren, die einer bezahlten Tätigkeit von mindestens einer Wochenstunde nachgehen, Selbständige und mithelfende Familienangehörige, Präsenz- und Zivildiener sind eingeschlossen, Personen in Karenz werden nicht berücksichtigt.
7 Land- und Forstwirtschaft
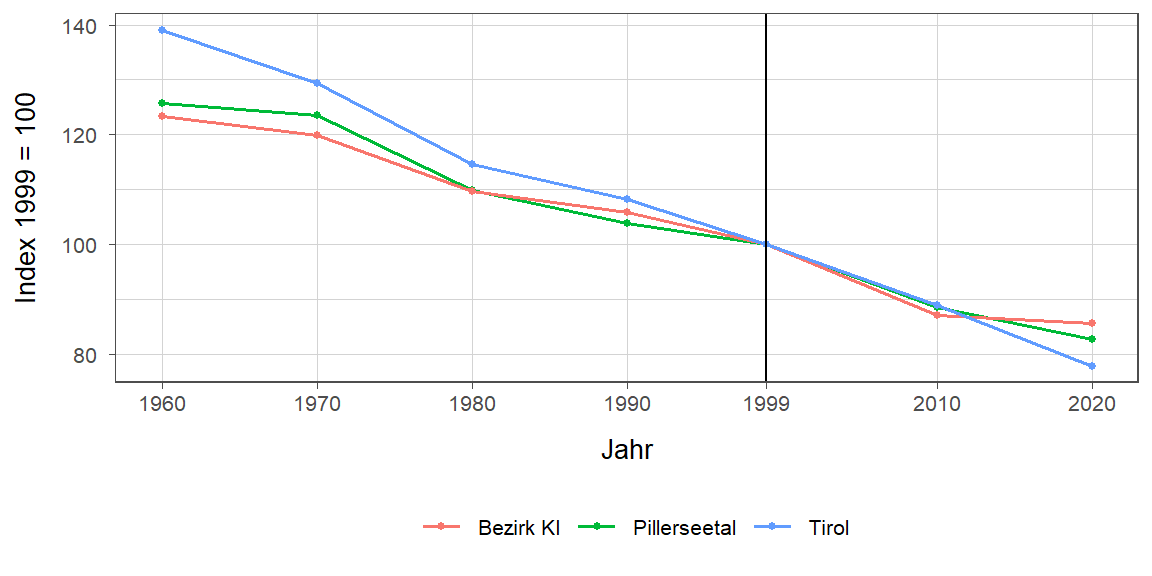
| Jahr | Betriebe | Index 1999 = 100 | ||||
|---|---|---|---|---|---|---|
| Pillerseetal | Bezirk KI | Tirol | Pillerseetal | Bezirk KI | Tirol | |
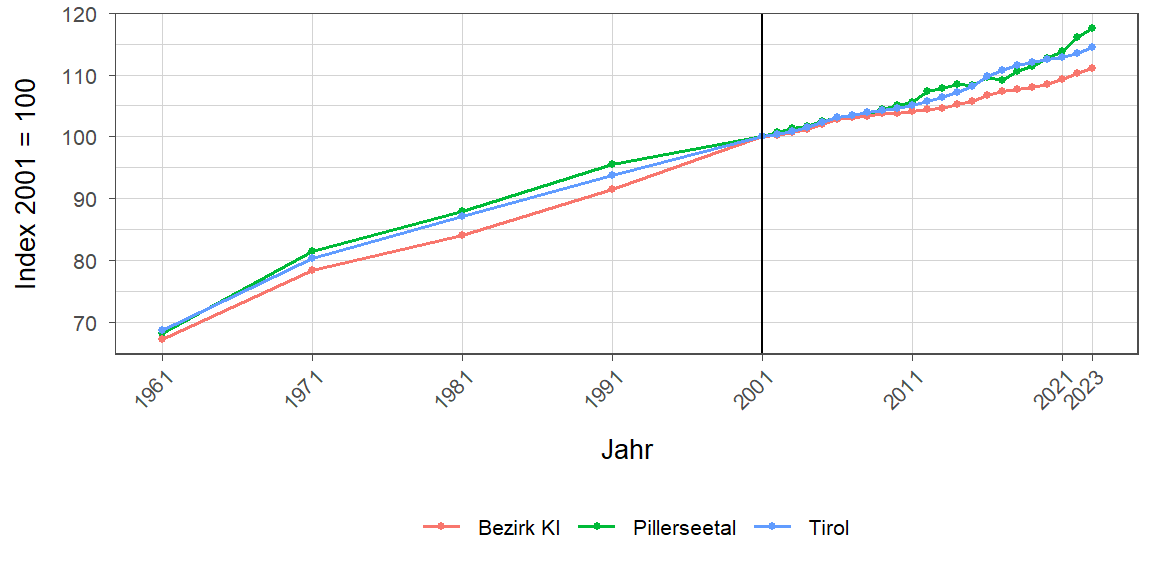
| 1960 | 454 | 2.682 | 25.365 | 125,8 | 123,3 | 139,1 |
| 1970 | 446 | 2.606 | 23.600 | 123,5 | 119,8 | 129,4 |
| 1980 | 397 | 2.388 | 20.913 | 110,0 | 109,8 | 114,7 |
| 1990 | 375 | 2.302 | 19.739 | 103,9 | 105,8 | 108,2 |
| 1999 | 361 | 2.175 | 18.238 | 100,0 | 100,0 | 100,0 |
| 2010 | 320 | 1.894 | 16.215 | 88,6 | 87,1 | 88,9 |
| 2020 | 299 | 1.863 | 14.215 | 82,8 | 85,7 | 77,9 |
- Quelle: Statistik Austria, Land- und Forstwirtschaftliche Betriebszählung bzw. Agrarstrukturerhebung
Abbildung 4: Entwicklung der Anzahl an land- und forstwirtschaftlichen Betrieben
| Erwerbsart | Betriebe | Anteil an allen Betrieben in % | ||||
|---|---|---|---|---|---|---|
| Pillerseetal | Bezirk KI | Tirol | Pillerseetal | Bezirk KI | Tirol | |
| Haupterwerb | 112 | 793 | 4.749 | 37,5 | 42,6 | 33,4 |
| Nebenerwerb | 154 | 903 | 7.916 | 51,5 | 48,5 | 55,7 |
| Pers.Gem. | 9 | 48 | 322 | 3,0 | 2,6 | 2,3 |
| jur. Person | 24 | 119 | 1.228 | 8,0 | 6,4 | 8,6 |
- Quelle: Statistik Austria, Agrarstrukturerhebung
- Pers.Gem: Personengemeinschaften
- jur. Person: Juristische Personen
| EP-GR¹ | Betriebe | Anteil an allen Betrieben in % | ||||
|---|---|---|---|---|---|---|
| Pillerseetal | Bezirk KI | Tirol | Pillerseetal | Bezirk KI | Tirol | |
| EP-GR 1 | 48 | 305 | 2.015 | 16,1 | 16,4 | 14,2 |
| EP-GR 2 | 103 | 465 | 2.268 | 34,4 | 25,0 | 16,0 |
| EP-GR 3 | 22 | 285 | 2.265 | 7,4 | 15,3 | 15,9 |
| EP-GR 4 | 6 | 177 | 2.803 | 2,0 | 9,5 | 19,7 |
| keine Erschwernis | 120 | 631 | 4.864 | 40,1 | 33,9 | 34,2 |
- Quelle: Quelle: Statistik Austria, Agrarstrukturerhebung
- ¹ Zuordnung der Betriebe nach Erschwernispunkten
- Bei der Agrarstrukturerhebung 2020 wurden analog zum Grünen Bericht die Betriebe nach ihren Erschwernispunkten den Erschwernispunktegruppen (EPGruppe 1 bis 4)zugeordnet. Die Erschwernispunkte-Gruppen (EP-Gruppen)setzen sich wie folgt zusammen:
- EP-Gruppe 1: 5 bis 90 Erschwernispunkte
- EP-Gruppe 2: 91 bis 180 Erschwernispunkte
- EP-Gruppe 3: 181 bis 270 Erschwernispunkte
- EP-Gruppe 4: über 270 (bis maximal 540) Erschwernispunkte
- Die Zuordnung der Erschwernispunkte wird im Rahmen des jährlichen Mehrfachantrag-Flächen durchgeführt. Das System der Erschwernispunktegruppen (EP-Gruppen) ist nur bedingt mit den bisherigen Systemen der Einteilung bergbäuerlicher Betriebe bzw. Erschwernisbeurteilung vergleichbar. Betriebe mit weniger als 5 Erschwernispunkten werden in der in der Gruppe „Ohne Erschwernis“ ausgewiesen.
8 Tourismus
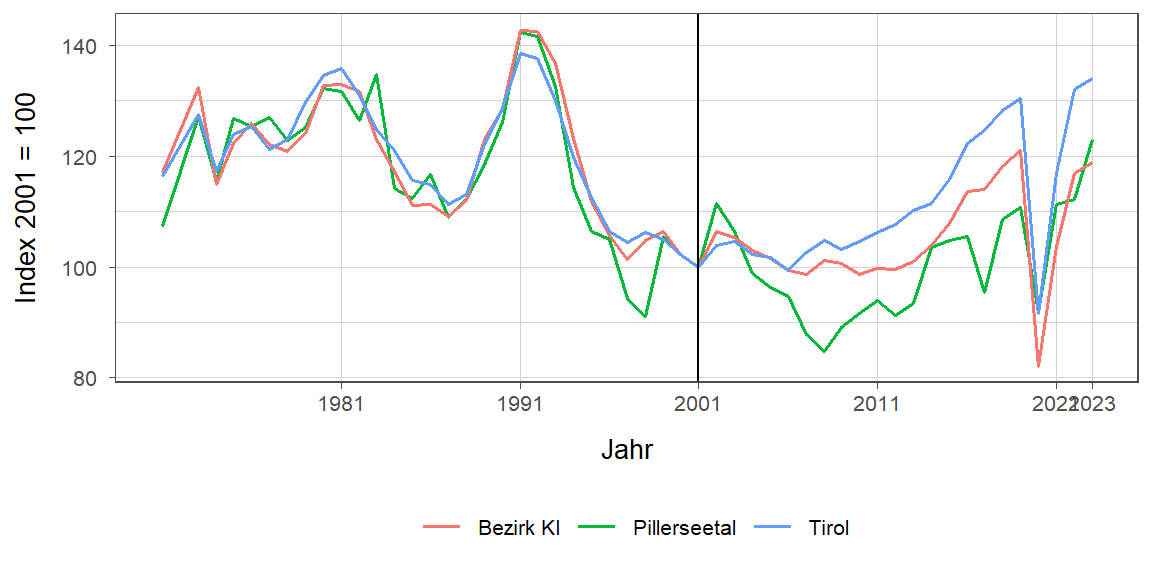
| Jahr | Nächtigungen | Index 2001 = 100 | ||||
|---|---|---|---|---|---|---|
| Pillerseetal | Bezirk KI | Tirol | Pillerseetal | Bezirk KI | Tirol | |
| 1981 | 513.852 | 3.272.598 | 17.771.714 | 90,2 | 99,1 | 75,6 |
| 1991 | 574.800 | 3.287.533 | 21.774.674 | 100,9 | 99,6 | 92,6 |
| 2001 | 569.697 | 3.302.253 | 23.503.160 | 100,0 | 100,0 | 100,0 |
| 2011 | 492.233 | 3.115.951 | 24.830.645 | 86,4 | 94,4 | 105,6 |
| 2021 | 20.615 | 79.644 | 712.998 | 3,6 | 2,4 | 3,0 |
| 2025 | 554.989 | 2.983.640 | 26.417.509 | 97,4 | 90,4 | 112,4 |
- Quelle: AdTLR, Raumordnung und Statistik, Tourismusstatistik
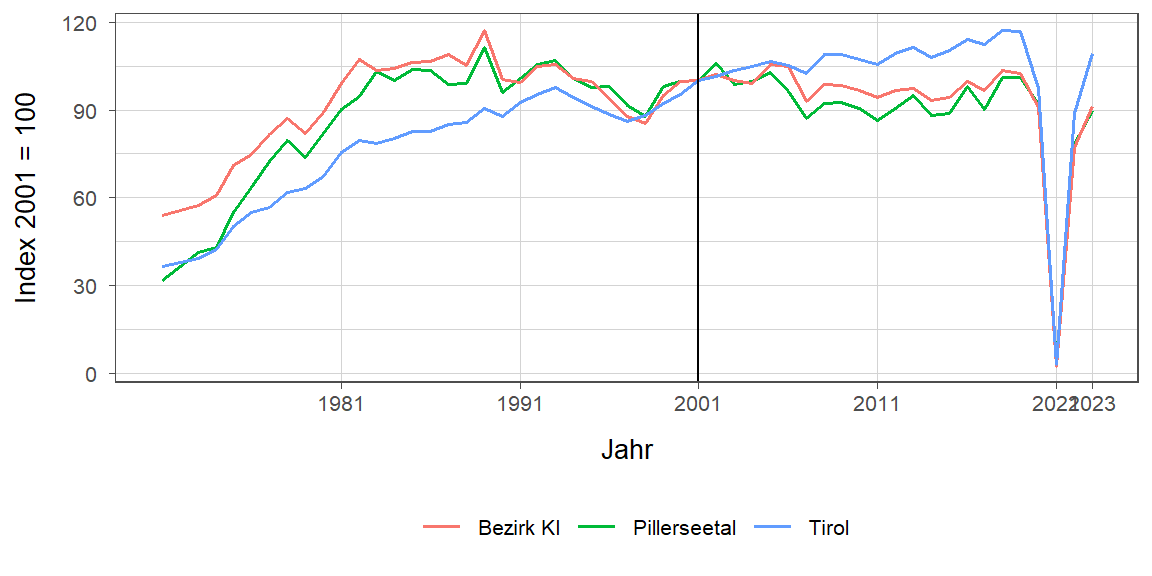
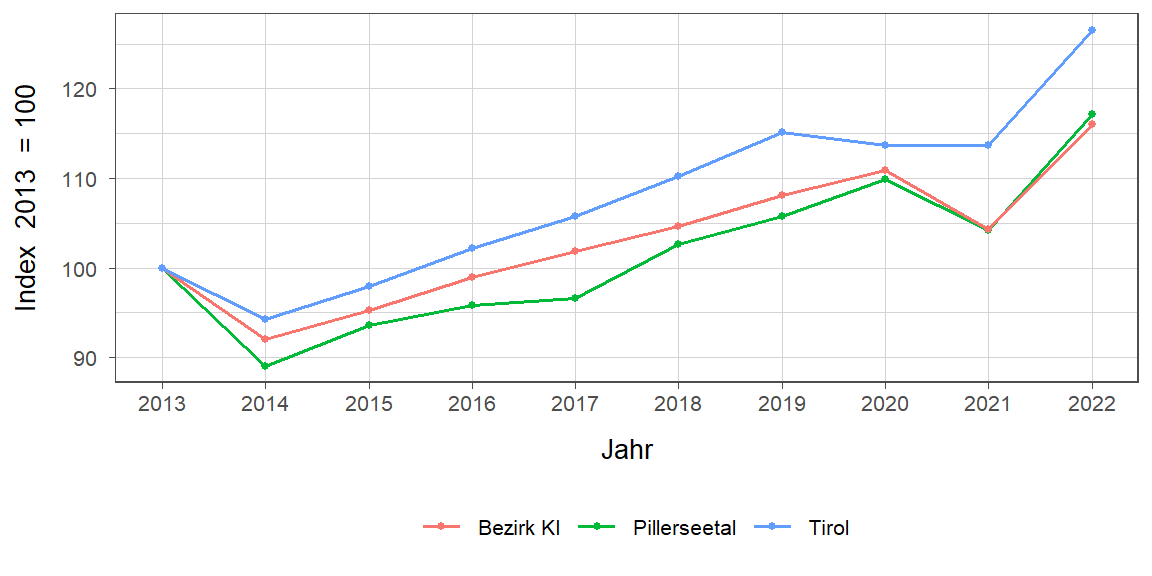
Abbildung 5: Nächtigungsentwicklung im Winter
| Jahr | Nächtigungen | Index 2014 = 100 | ||||
|---|---|---|---|---|---|---|
| Pillerseetal | Bezirk KI | Tirol | Pillerseetal | Bezirk KI | Tirol | |
| 2014 | 501.269 | 3.081.332 | 25.370.402 | 100,0 | 100,0 | 100,0 |
| 2015 | 506.198 | 3.110.843 | 25.960.806 | 101,0 | 101,0 | 102,3 |
| 2016 | 559.566 | 3.290.870 | 26.804.089 | 111,6 | 106,8 | 105,7 |
| 2017 | 514.712 | 3.193.148 | 26.463.873 | 102,7 | 103,6 | 104,3 |
| 2018 | 575.739 | 3.416.675 | 27.583.016 | 114,9 | 110,9 | 108,7 |
| 2019 | 575.896 | 3.388.395 | 27.485.847 | 114,9 | 110,0 | 108,3 |
| 2020 | 524.398 | 3.003.619 | 22.925.568 | 104,6 | 97,5 | 90,4 |
| 2021 | 20.615 | 79.644 | 712.998 | 4,1 | 2,6 | 2,8 |
| 2022 | 444.663 | 2.545.629 | 20.909.636 | 88,7 | 82,6 | 82,4 |
| 2023 | 512.282 | 3.016.557 | 25.707.235 | 102,2 | 97,9 | 101,3 |
| 2024 | 529.471 | 2.968.972 | 26.032.509 | 105,6 | 96,4 | 102,6 |
| 2025 | 554.989 | 2.983.640 | 26.417.509 | 110,7 | 96,8 | 104,1 |
- Quelle: AdTLR, Raumordnung und Statistik, Tourismusstatistik
| Kategorie | Nächtigungen | in % | ||||
|---|---|---|---|---|---|---|
| Pillerseetal | Bezirk KI | Tirol | Pillerseetal | Bezirk KI | Tirol | |
| Gewerblich | 337.793 | 2.117.724 | 19.853.214 | 60,9 | 71,0 | 75,2 |
| davon ***** / **** | 159.433 | 1.031.654 | 9.170.826 | 28,7 | 34,6 | 34,7 |
| *** | 26.539 | 377.358 | 3.656.614 | 4,8 | 12,6 | 13,8 |
| ** / * | 62.706 | 212.840 | 2.400.617 | 11,3 | 7,1 | 9,1 |
| Fewo gewerblich | 89.115 | 495.872 | 4.625.157 | 16,1 | 16,6 | 17,5 |
| Privat | 18.727 | 102.322 | 709.852 | 3,4 | 3,4 | 2,7 |
| Fewo privat | 129.812 | 592.223 | 4.886.064 | 23,4 | 19,8 | 18,5 |
| Campingplätze | 56.222 | 105.219 | 519.960 | 10,1 | 3,5 | 2,0 |
| Sonst. Unterkünfte | 12.435 | 66.152 | 448.419 | 2,2 | 2,2 | 1,7 |
| Gesamt | 554.989 | 2.983.640 | 26.417.509 | 100,0 | 100,0 | 100,0 |
- Quelle: Quelle: AdTLR, Raumordnung und Statistik, Tourismusstatistik
- G = Geheim, da weniger als 3 Betriebe vorhanden
| Jahr | Nächtigungen | Index 2001 = 100 | ||||
|---|---|---|---|---|---|---|
| Pillerseetal | Bezirk KI | Tirol | Pillerseetal | Bezirk KI | Tirol | |
| 1981 | 559.812 | 3.393.837 | 23.095.058 | 131,6 | 132,9 | 135,8 |
| 1991 | 604.952 | 3.643.597 | 23.561.062 | 142,2 | 142,7 | 138,5 |
| 2001 | 425.274 | 2.552.724 | 17.006.337 | 100,0 | 100,0 | 100,0 |
| 2011 | 399.692 | 2.546.799 | 18.068.597 | 94,0 | 99,8 | 106,2 |
| 2021 | 473.583 | 2.648.078 | 19.865.249 | 111,4 | 103,7 | 116,8 |
| 2025 | 555.445 | 3.047.750 | 23.165.105 | 130,6 | 119,4 | 136,2 |
- Quelle: AdTLR, Raumordnung und Statistik, Tourismusstatistik
Abbildung 6: Nächtigungsentwicklung im Sommer
| Jahr | Nächtigungen | Index 2014 = 100 | ||||
|---|---|---|---|---|---|---|
| Pillerseetal | Bezirk KI | Tirol | Pillerseetal | Bezirk KI | Tirol | |
| 2014 | 440.134 | 2.650.504 | 18.959.548 | 100,0 | 100,0 | 100,0 |
| 2015 | 445.603 | 2.752.930 | 19.676.251 | 101,2 | 103,9 | 103,8 |
| 2016 | 448.842 | 2.902.301 | 20.796.138 | 102,0 | 109,5 | 109,7 |
| 2017 | 405.702 | 2.909.019 | 21.193.135 | 92,2 | 109,8 | 111,8 |
| 2018 | 461.349 | 3.014.322 | 21.806.765 | 104,8 | 113,7 | 115,0 |
| 2019 | 470.771 | 3.091.251 | 22.163.110 | 107,0 | 116,6 | 116,9 |
| 2020 | 390.355 | 2.096.602 | 15.580.308 | 88,7 | 79,1 | 82,2 |
| 2021 | 473.583 | 2.648.078 | 19.865.249 | 107,6 | 99,9 | 104,8 |
| 2022 | 476.730 | 2.985.102 | 22.448.264 | 108,3 | 112,6 | 118,4 |
| 2023 | 523.271 | 3.033.309 | 22.788.556 | 118,9 | 114,4 | 120,2 |
| 2024 | 538.148 | 2.995.815 | 22.735.856 | 122,3 | 113,0 | 119,9 |
| 2025 | 555.445 | 3.047.750 | 23.165.105 | 126,2 | 115,0 | 122,2 |
- Quelle: AdTLR, Raumordnung und Statistik, Tourismusstatistik
| Kategorie | Nächtigungen | in % | ||||
|---|---|---|---|---|---|---|
| Pillerseetal | Bezirk KI | Tirol | Pillerseetal | Bezirk KI | Tirol | |
| Gewerblich | 335.667 | 2.165.470 | 16.242.726 | 60,4 | 71,1 | 70,1 |
| davon ***** / **** | 169.039 | 1.157.929 | 8.200.223 | 30,4 | 38,0 | 35,4 |
| *** | 24.290 | 398.901 | 3.219.636 | 4,4 | 13,1 | 13,9 |
| ** / * | 68.035 | 203.559 | 1.770.981 | 12,2 | 6,7 | 7,6 |
| Fewo gewerblich | 74.303 | 405.081 | 3.051.886 | 13,4 | 13,3 | 13,2 |
| Privat | 14.975 | 86.674 | 538.281 | 2,7 | 2,8 | 2,3 |
| Fewo privat | 107.258 | 488.073 | 3.516.354 | 19,3 | 16,0 | 15,2 |
| Campingplätze | 85.029 | 254.830 | 1.985.579 | 15,3 | 8,4 | 8,6 |
| Sonst. Unterkünfte | 12.516 | 52.703 | 882.165 | 2,3 | 1,7 | 3,8 |
| Gesamt | 555.445 | 3.047.750 | 23.165.105 | 100,0 | 100,0 | 100,0 |
- Quelle: Quelle: AdTLR, Raumordnung und Statistik, Tourismusstatistik
- G = Geheim, da weniger als 3 Betriebe vorhanden
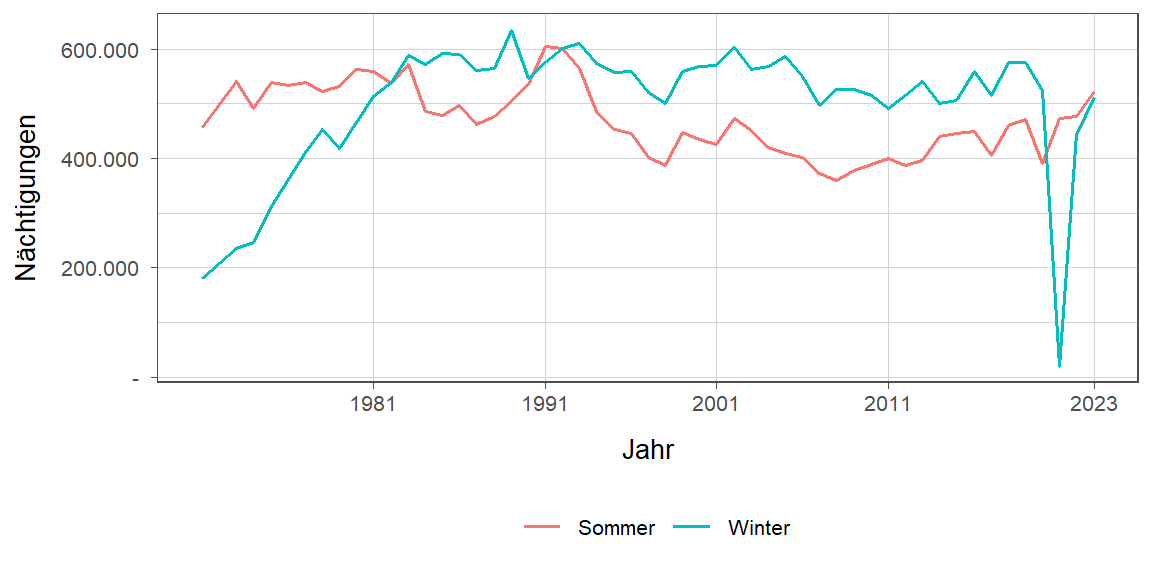
Abbildung 7: Nächtigungsentwicklung im Vergleich Winter zu Sommer
| Kategorie | Betriebe Winter | in % | ||||
|---|---|---|---|---|---|---|
| Pillerseetal | Bezirk KI | Tirol | Pillerseetal | Bezirk KI | Tirol | |
| Gewerblich | 97 | 831 | 6.233 | 16,6 | 25,7 | 28,8 |
| davon ***** / **** | 12 | 90 | 937 | 2,1 | 2,8 | 4,3 |
| *** | 11 | 109 | 1.003 | 1,9 | 3,4 | 4,6 |
| ** / * | 27 | 141 | 1.134 | 4,6 | 4,4 | 5,2 |
| Fewo gewerblich | 47 | 491 | 3.159 | 8,1 | 15,2 | 14,6 |
| Privat | 62 | 412 | 2.367 | 10,6 | 12,7 | 10,9 |
| Fewo privat | 403 | 1.936 | 12.669 | 69,1 | 59,9 | 58,4 |
| Sonst. Unterkünfte | 21 | 55 | 406 | 3,6 | 1,7 | 1,9 |
| Gesamt | 583 | 3.234 | 21.675 | 100,0 | 100,0 | 100,0 |
- Quelle: Quelle: AdTLR, Raumordnung und Statistik, Tourismusstatistik
| Kategorie | Betriebe Sommer | in % | ||||
|---|---|---|---|---|---|---|
| Pillerseetal | Bezirk KI | Tirol | Pillerseetal | Bezirk KI | Tirol | |
| Gewerblich | 100 | 836 | 6.068 | 17,4 | 26,2 | 28,3 |
| davon ***** / **** | 12 | 86 | 894 | 2,1 | 2,7 | 4,2 |
| *** | 10 | 113 | 977 | 1,7 | 3,5 | 4,5 |
| ** / * | 27 | 137 | 1.094 | 4,7 | 4,3 | 5,1 |
| Fewo gewerblich | 51 | 500 | 3.103 | 8,9 | 15,7 | 14,4 |
| Privat | 58 | 386 | 2.309 | 10,1 | 12,1 | 10,8 |
| Fewo privat | 396 | 1.902 | 12.420 | 68,9 | 59,7 | 57,8 |
| Sonst. Unterkünfte | 21 | 64 | 681 | 3,7 | 2,0 | 3,2 |
| Gesamt | 575 | 3.188 | 21.478 | 100,0 | 100,0 | 100,0 |
- Quelle: Quelle: AdTLR, Raumordnung und Statistik, Tourismusstatistik
| Kategorie | Betten Winter | in % | ||||
|---|---|---|---|---|---|---|
| Pillerseetal | Bezirk KI | Tirol | Pillerseetal | Bezirk KI | Tirol | |
| Gewerblich | 4.663 | 29.385 | 228.897 | 59,5 | 65,1 | 67,4 |
| davon ***** / **** | 1.686 | 12.095 | 91.914 | 21,5 | 26,8 | 27,0 |
| *** | 431 | 4.968 | 44.612 | 5,5 | 11,0 | 13,1 |
| ** / * | 1.110 | 3.994 | 32.555 | 14,2 | 8,8 | 9,6 |
| Fewo gewerblich | 1.436 | 8.328 | 59.816 | 18,3 | 18,4 | 17,6 |
| Privat | 456 | 2.827 | 16.771 | 5,8 | 6,3 | 4,9 |
| Fewo privat | 2.336 | 11.576 | 83.218 | 29,8 | 25,6 | 24,5 |
| Sonst. Unterkünfte | 384 | 1.374 | 10.958 | 4,9 | 3,0 | 3,2 |
| Gesamt | 7.839 | 45.162 | 339.844 | 100,0 | 100,0 | 100,0 |
- Quelle: Quelle: AdTLR, Raumordnung und Statistik, Tourismusstatistik
| Kategorie | Betten Sommer | in % | ||||
|---|---|---|---|---|---|---|
| Pillerseetal | Bezirk KI | Tirol | Pillerseetal | Bezirk KI | Tirol | |
| Gewerblich | 4.642 | 29.208 | 221.803 | 59,5 | 65,1 | 65,8 |
| davon ***** / **** | 1.685 | 11.711 | 88.004 | 21,6 | 26,1 | 26,1 |
| *** | 372 | 5.046 | 43.700 | 4,8 | 11,2 | 13,0 |
| ** / * | 1.110 | 4.142 | 31.257 | 14,2 | 9,2 | 9,3 |
| Fewo gewerblich | 1.475 | 8.309 | 58.842 | 18,9 | 18,5 | 17,4 |
| Privat | 427 | 2.681 | 16.321 | 5,5 | 6,0 | 4,8 |
| Fewo privat | 2.313 | 11.341 | 81.473 | 29,6 | 25,3 | 24,2 |
| Sonst. Unterkünfte | 422 | 1.632 | 17.722 | 5,4 | 3,6 | 5,3 |
| Gesamt | 7.804 | 44.862 | 337.319 | 100,0 | 100,0 | 100,0 |
- Quelle: Quelle: AdTLR, Raumordnung und Statistik, Tourismusstatistik
| Kategorie | Auslastung in % ¹ | |||||
|---|---|---|---|---|---|---|
| Pillerseetal | Bezirk KI | Tirol | ||||
| Winter | Sommer | Winter | Sommer | Winter | Sommer | |
| Gewerblich | 40,0 | 39,3 | 39,8 | 40,3 | 47,9 | 39,8 |
| davon ***** / **** | 52,2 | 54,5 | 47,1 | 53,7 | 55,1 | 50,6 |
| *** | 34,0 | 35,5 | 42,0 | 43,0 | 45,3 | 40,0 |
| ** / * | 31,2 | 33,3 | 29,4 | 26,7 | 40,7 | 30,8 |
| Fewo gewerblich | 34,3 | 27,4 | 32,9 | 26,5 | 42,7 | 28,2 |
| Privat | 22,7 | 19,1 | 20,0 | 17,6 | 23,4 | 17,9 |
| Fewo privat | 30,7 | 25,2 | 28,3 | 23,4 | 32,4 | 23,5 |
| Sonst. Unterkünfte | 17,9 | 16,1 | 26,6 | 17,6 | 22,6 | 27,1 |
| Gesamt | 35,2 | 32,8 | 35,2 | 33,8 | 42,1 | 34,1 |
- Quelle: Quelle: AdTLR, Raumordnung und Statistik, Tourismusstatistik
- ¹ Winter: 100 Prozent entsprechen 181 (bzw. 182 im Schaltjahr) Vollbelegungstagen
- Sommer: 100 Prozent entsprechen 184 Vollbelegstagen
- Aus Datenverfügbarkeitsgründen wurde die Auslastung mit der Bettenzahl des Vorjahres berechnet
- G = Geheim, da weniger als 3 Betriebe vorhanden
9 Grundversorgung der Tiroler Bevölkerung
| Einrichtungen | Pillerseetal | Bezirk KI | Tirol |
|---|---|---|---|
| Nahversorger | 10 | 77 | 690 |
| Verkaufsfläche der Nahversorger (in m²) | 4.108 | 32.505 | 356.831 |
| Verkaufsfläche (in m²/Einwohner) | 0 | 0 | 0 |
| Metzger | 3 | 16 | 149 |
| Baecker | 10 | 35 | 374 |
| Polizeiinspektion | 1 | 9 | 78 |
| Praktischer_Arzt | 5 | 57 | 674 |
| Zahnheilkunde | 3 | 36 | 427 |
| Apotheke | 1 | 11 | 131 |
| Hausapotheke | 2 | 7 | 55 |
| Altersheim | 1 | 9 | 93 |
| Postamt | - | 4 | 37 |
| Postpartner | 4 | 12 | 114 |
| Bankfiliale | 5 | 47 | 409 |
| Tankstelle | 4 | 29 | 304 |
| Kinderkrippe | 3 | 24 | 310 |
| Kindergarten | 5 | 27 | 484 |
| Hort | 1 | 10 | 114 |
| Volksschule | 7 | 28 | 351 |
| Mittelschule | 1 | 8 | 106 |
| Sonderschule | - | 1 | 20 |
| Poly | - | 2 | 28 |
| AHS | - | 1 | 27 |
- Quelle: AdTLR, Raumordnung und Statistik, Erhebung zur Grundversorgung der Tiroler Bevölkerung
10 Gemeindefinanzen
| Jahr | Steuern in Tsd. Euro | Index 2015 = 100 | ||||
|---|---|---|---|---|---|---|
| Pillerseetal | Bezirk KI | Tirol | Pillerseetal | Bezirk KI | Tirol | |
| 2015 | 3.802 | 31.929 | 345.545 | 100,0 | 100,0 | 100,0 |
| 2016 | 3.894 | 33.167 | 360.435 | 102,4 | 103,9 | 104,3 |
| 2017 | 3.924 | 34.120 | 373.058 | 103,2 | 106,9 | 108,0 |
| 2018 | 4.169 | 35.058 | 388.551 | 109,6 | 109,8 | 112,4 |
| 2019 | 4.296 | 36.227 | 405.946 | 113,0 | 113,5 | 117,5 |
| 2020 | 4.464 | 37.156 | 400.991 | 117,4 | 116,4 | 116,0 |
| 2021 | 4.231 | 34.947 | 400.778 | 111,3 | 109,5 | 116,0 |
| 2022 | 4.758 | 38.882 | 446.231 | 125,1 | 121,8 | 129,1 |
| 2023 | 4.939 | 41.609 | 486.467 | 129,9 | 130,3 | 140,8 |
| 2024 | 5.414 | 44.837 | 525.163 | 142,4 | 140,4 | 152,0 |
- Quelle: AdTLR, Abt. Gemeinden, Die Finanzlage der Gemeinden Tirols
| Jahr | Pro Einwohner in Euro | Index 2015 = 100 | ||||
|---|---|---|---|---|---|---|
| Pillerseetal | Bezirk KI | Tirol | Pillerseetal | Bezirk KI | Tirol | |
| 2015 | 379 | 506 | 467 | 100,0 | 100,0 | 100,0 |
| 2016 | 391 | 522 | 483 | 103,0 | 103,3 | 103,3 |
| 2017 | 388 | 536 | 497 | 102,3 | 105,9 | 106,2 |
| 2018 | 409 | 549 | 515 | 107,9 | 108,5 | 110,1 |
| 2019 | 417 | 565 | 536 | 110,0 | 111,6 | 114,6 |
| 2020 | 429 | 574 | 528 | 113,2 | 113,6 | 112,8 |
| 2021 | 399 | 535 | 525 | 105,2 | 105,8 | 112,2 |
| 2022 | 443 | 591 | 579 | 116,8 | 116,9 | 123,8 |
| 2023 | 459 | 630 | 627 | 121,0 | 124,5 | 134,1 |
| 2024 | 504 | 679 | 675 | 132,8 | 134,2 | 144,5 |
- Quelle: AdTLR, Abt. Gemeinden, Die Finanzlage der Gemeinden Tirols
- ¹ Ausschließliche Gemeindeabgaben i. S. des Finanzausgleichsgesetztes
- (Grundsteuer A und B, Kommunalsteuer, Sonstige Steuern)
Abbildung 8: Entwicklung der Eigenen Steuern
| Jahr | Abgabenertragsanteie in Tsd. Euro | Index 2015 = 100 | ||||
|---|---|---|---|---|---|---|
| Pillerseetal | Bezirk KI | Tirol | Pillerseetal | Bezirk KI | Tirol | |
| 2015 | 9.163 | 58.186 | 733.155 | 100,0 | 100,0 | 100,0 |
| 2016 | 9.272 | 59.000 | 751.116 | 101,2 | 101,4 | 102,4 |
| 2017 | 9.341 | 59.214 | 756.870 | 101,9 | 101,8 | 103,2 |
| 2018 | 9.612 | 61.950 | 792.641 | 104,9 | 106,5 | 108,1 |
| 2019 | 10.328 | 66.368 | 851.034 | 112,7 | 114,1 | 116,1 |
| 2020 | 9.528 | 60.648 | 777.780 | 104,0 | 104,2 | 106,1 |
| 2021 | 11.259 | 71.032 | 907.213 | 122,9 | 122,1 | 123,7 |
| 2022 | 12.798 | 80.198 | 1.031.610 | 139,7 | 137,8 | 140,7 |
| 2023 | 12.467 | 77.368 | 998.209 | 136,1 | 133,0 | 136,2 |
| 2024 | 12.893 | 80.137 | 1.028.821 | 140,7 | 137,7 | 140,3 |
- Quelle: AdTLR, Abt. Gemeinden, Die Finanzlage der Gemeinden Tirols
| Jahr | Pro Einwohner in Euro | Index 2015 = 100 | ||||
|---|---|---|---|---|---|---|
| Pillerseetal | Bezirk KI | Tirol | Pillerseetal | Bezirk KI | Tirol | |
| 2015 | 914 | 922 | 992 | 100,0 | 100,0 | 100,0 |
| 2016 | 930 | 929 | 1.007 | 101,8 | 100,8 | 101,5 |
| 2017 | 924 | 930 | 1.008 | 101,1 | 100,9 | 101,6 |
| 2018 | 943 | 970 | 1.050 | 103,2 | 105,2 | 105,9 |
| 2019 | 1.003 | 1.034 | 1.123 | 109,8 | 112,2 | 113,2 |
| 2020 | 916 | 938 | 1.023 | 100,2 | 101,7 | 103,2 |
| 2021 | 1.062 | 1.088 | 1.187 | 116,2 | 118,1 | 119,7 |
| 2022 | 1.192 | 1.219 | 1.337 | 130,4 | 132,3 | 134,8 |
| 2023 | 1.159 | 1.171 | 1.286 | 126,8 | 127,1 | 129,7 |
| 2024 | 1.200 | 1.213 | 1.323 | 131,3 | 131,6 | 133,4 |
- Quelle: AdTLR, Abt. Gemeinden, Die Finanzlage der Gemeinden Tirols
- ¹ Anteile der Gemeinden an den gemeinschaftlichen Bundesabgaben lt. Finanzausgleichsgesetztes
Abbildung 9: Entwicklung der Abgabenertragsanteile